Custom Report Example 3
Another feature that can be useful is adding a chart to your results. Since many people understand visual information far more readily than a list of data, this can make reports much more meaningful. We'll start by cloning a certificate from the STANDARD Certificate Template.
Since the chart summarizes the collected data, we'll put it in the Group Footer. Drag the bottom edge of the Group Footer Band down, and add a DBChart.
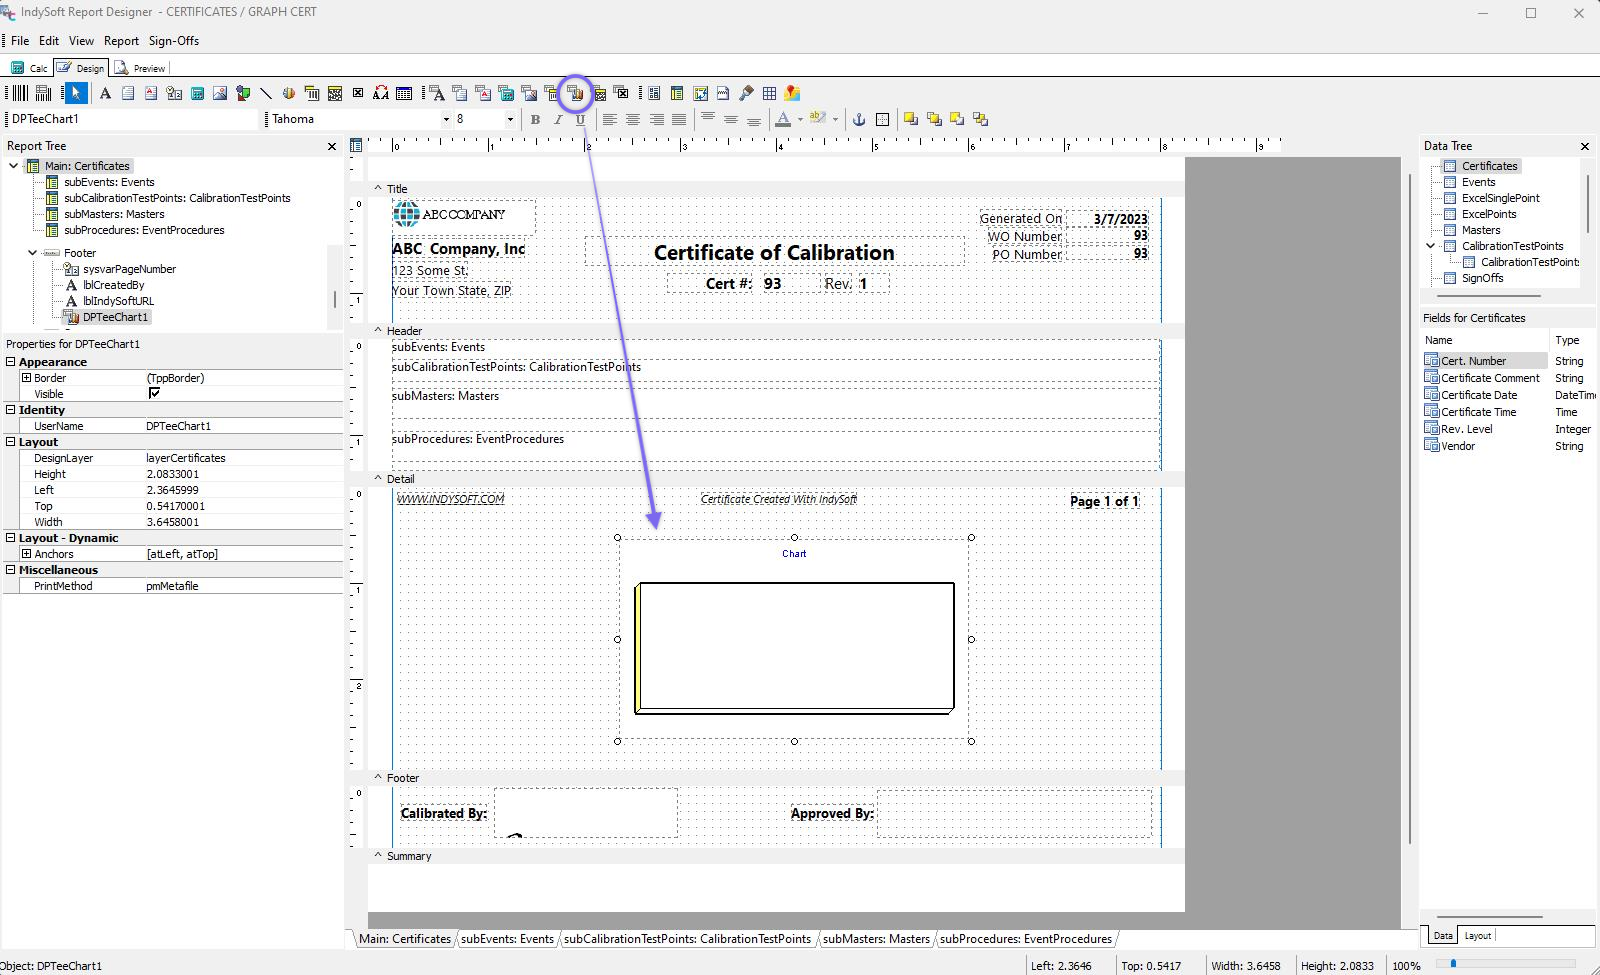
Design Tab - Group Chart
Unfortunately, this is not a very exciting chart. We need to tell it what it's a chart of before it will display anything. Right-click on the chart and choose Edit Chart... This is our problem; a chart comprises data called a Series. In this case, we don't have one.
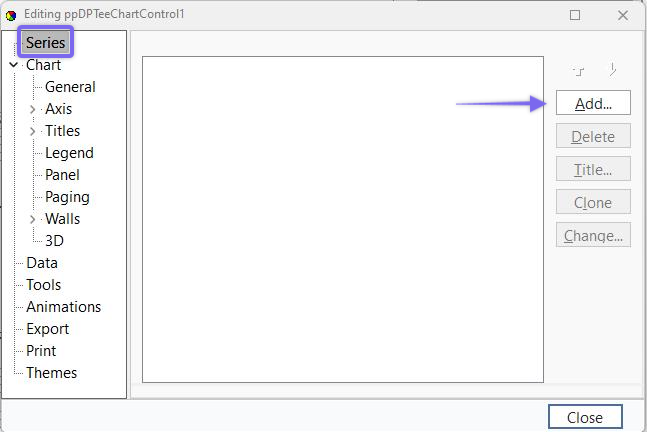
Edit Chart - Add Series
Clicking Add... allows us to choose our Series. For this example, we'll make a line chart, not 3D. We'll add four Series like this, one for each Standard, Tolerance +, Tolerance -, and As Found. Note: you can click 'Clone' three times to add the three series.
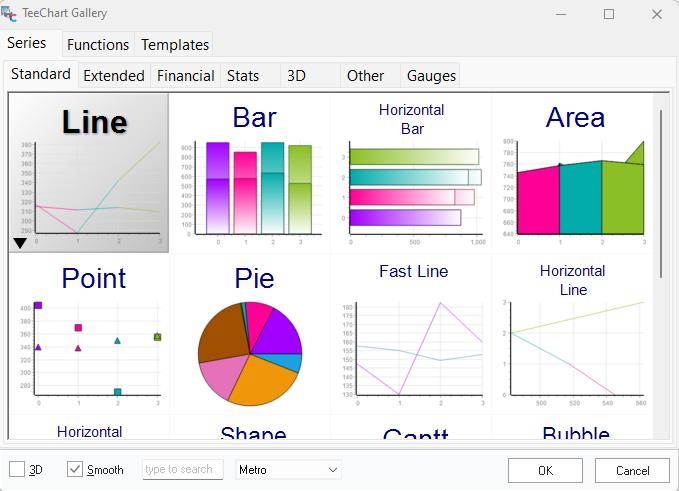
TeeChart Gallery
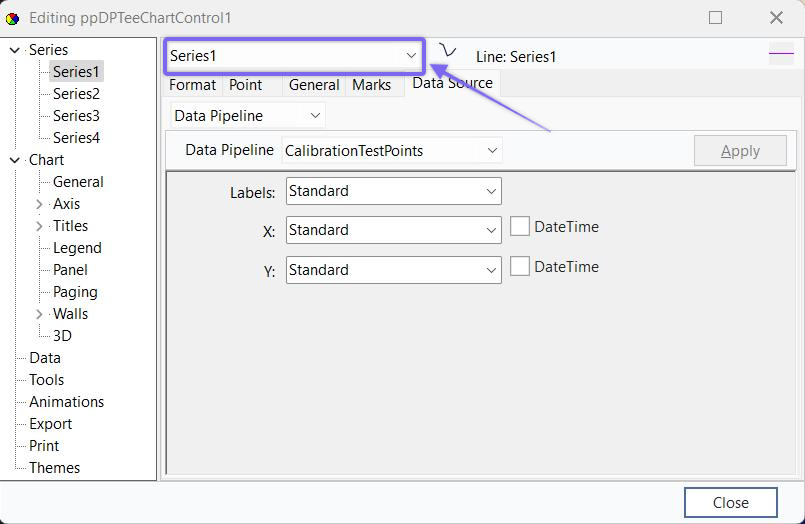
Next, data will need to be accessed. In this example, we do not want to enter the data, for that, manually would defeat the purpose of having a dynamic chart. Instead, double-click the Series 1 in the TeeChart control box. Click the 'Data Source' tab in the pop-up box, then set it to 'Data Pipeline.' The Pipeline will be 'CalibrationTestPoints.' For all four lines, the X coordinates will be our Standard. The Y coordinate will be what we are graphing. For Series1, the Y coordinate will be 'Standard'. For Series2: 'Tolerance +'; Series3: 'Tolerance -'; and for Series4: 'As Found'.
TeeChart Control Edit - Data Source
Note: Once you make the changes to Series1, click the 'Apply' button, then click the top dropdown (currently labeled Series1) to select the other Series (2 - 4) as applicable (or click in the tree to the left). Also, when you change the Y coordinate, make the Label reflect the same name as the Y coordinate. Once you make all the changes, click the 'Apply' button, then 'Close.'
TeeChart Control Edit - Series Dropdown
Next, change the Title of each Series to reflect what it is. Highlight the Series, then click the 'Title' button to edit. These titles will be displayed on the legend of the chart.
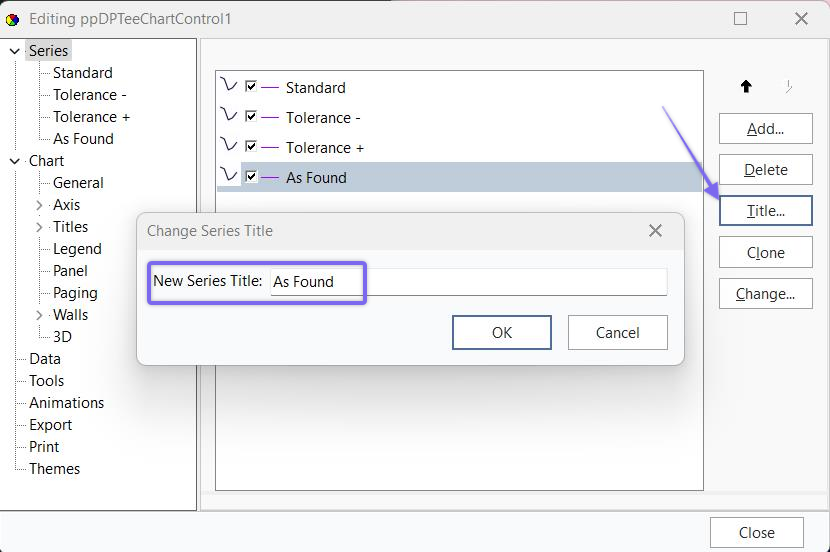
TeeChart Control - Editing Series Titles
To change the Title of the actual Chart, click on 'Titles' under 'Chart' in the tree to the left. Then type in the new title name in the text box. You can optionally format the title name with the additional tabs at the top.
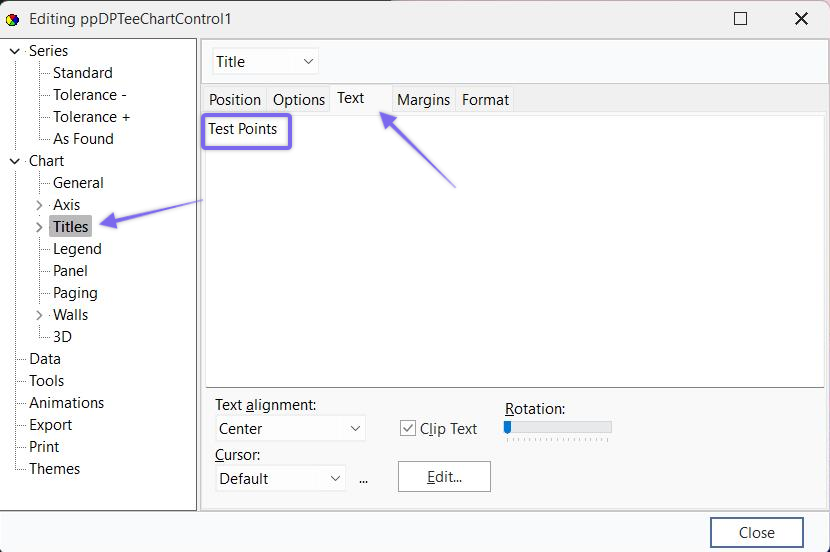
TeeChart Control - Editing Chart Title
At this point, your chart should look something like this:
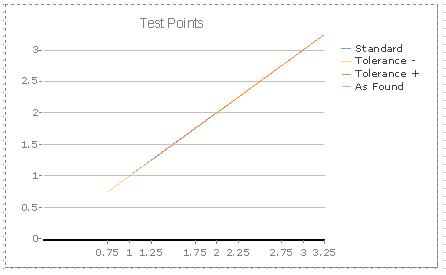
TestPoints Chart Example
Now to work on making this chart easier to read. Double-Click on the Chart (if the TeeChart Control window is closed) and then click Add...Functions tab and Subtract. This will create a new series that is found by subtracting two series. By doing this four times, we can get the difference between our original series and Standard.
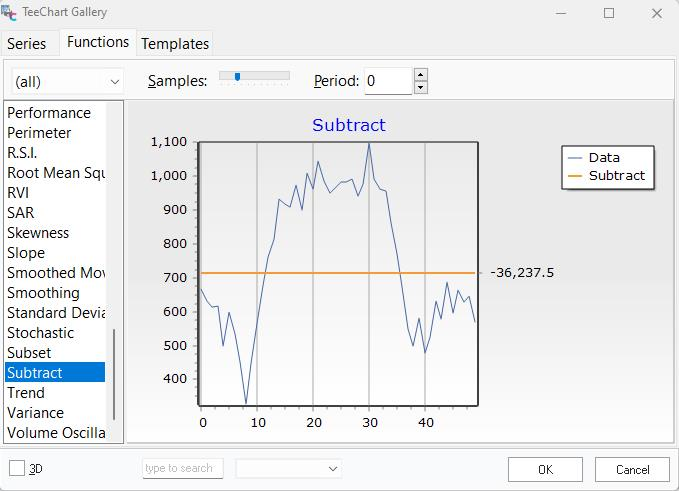
TeeChart Gallery - Functions
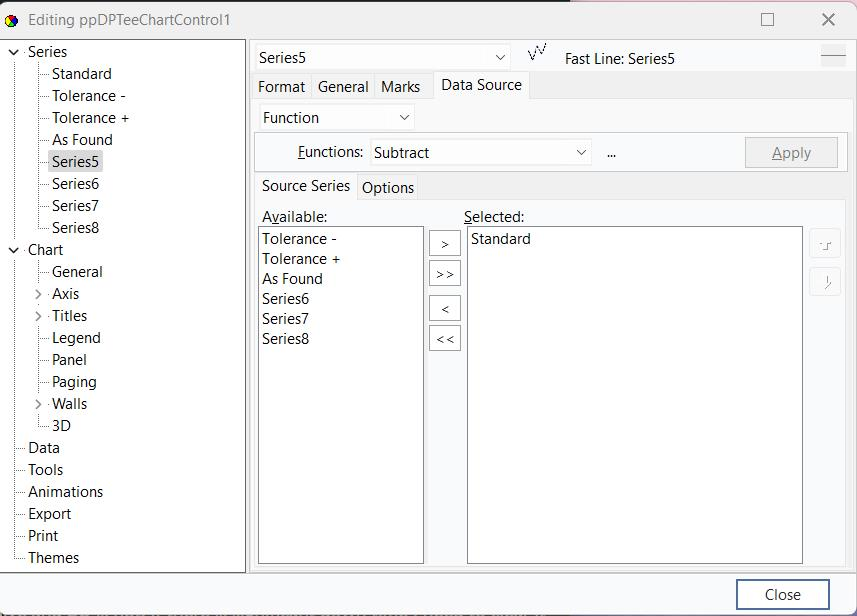
Next, double-click on the Series tab. Choose Series5 from the drop-down and choose the Data Source tab. Select Standard in the 'Available' window and click the right arrow to move it to the 'Selected' window. This will produce a series that is Standard - Standard = 0.
Select Series6 from the drop-down, and move Tolerance + and Standard to the right. Make sure that Tolerance + is above Standard. This will produce a series with values 'Tolerance +' - 'Standard.' Repeat this process to set Series7 as Tolerance - above Standard, and Series8 as As Found above Standard.
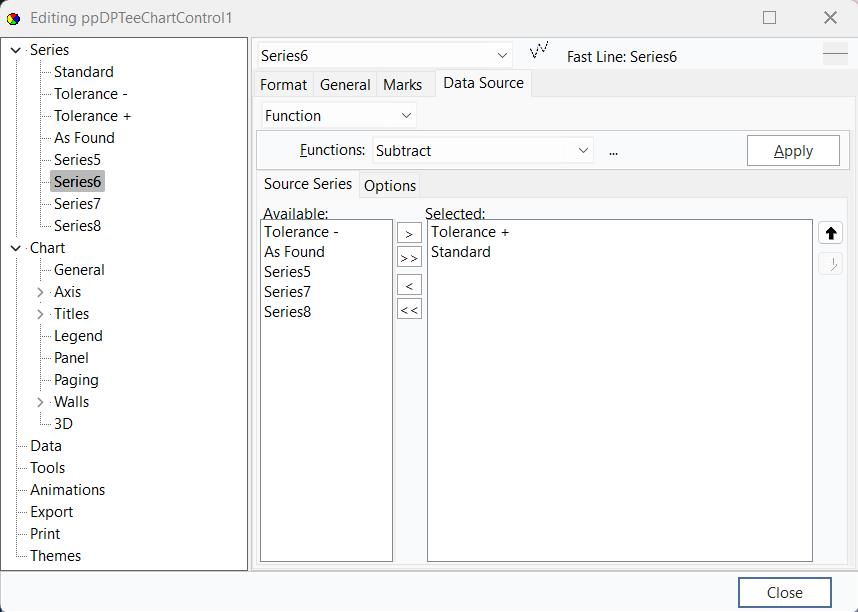
TeeChart Control - Series 6 example
Return to the Chart tab and rename the series to 'AtStandard,' 'Tol+ - Standard,' 'Tol- - Standard,' and 'AsFound - Standard.'
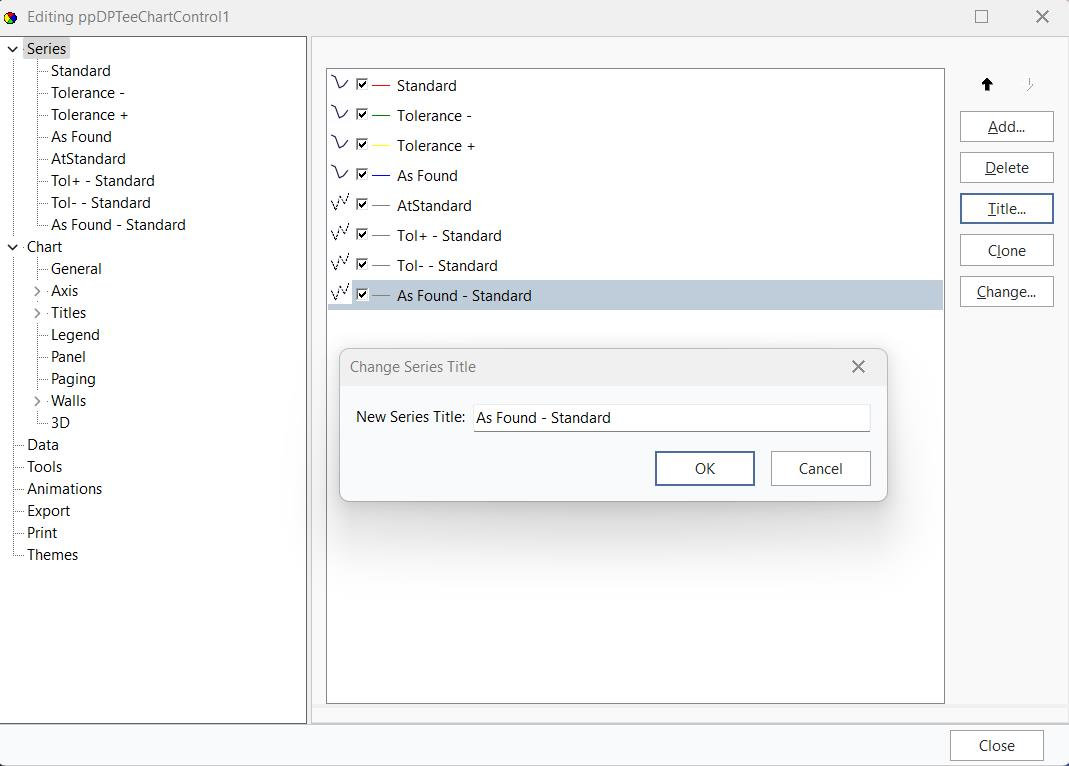
TeeChart Control - Editing Series Titles
Go to Series, click the color button (see below), and change the colors so they aren't all green.
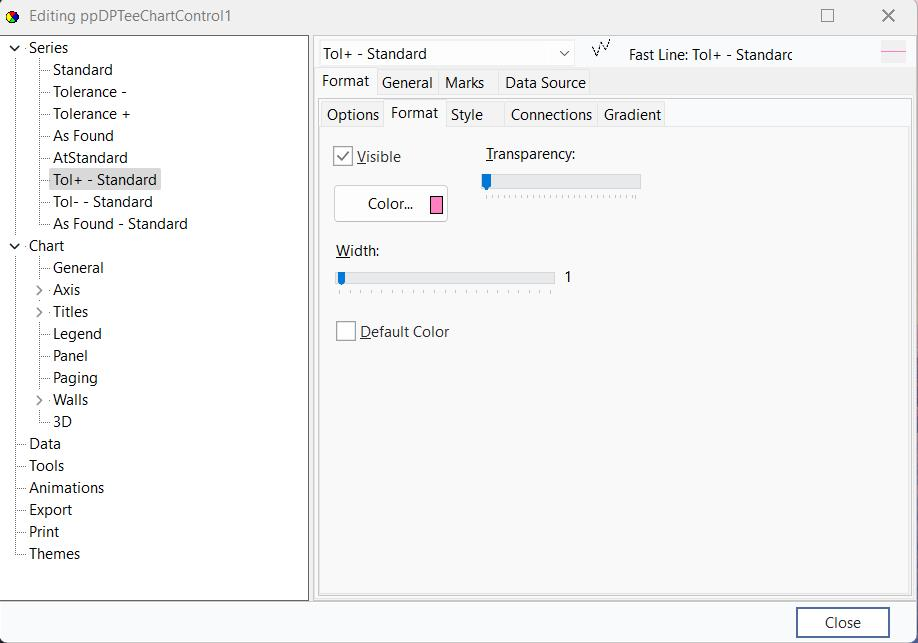
TeeChart Control - Edit Color
Finally, uncheck Standard, Tolerance +, Tolerance -, and As Found. We need them for the last four series but don't want them displayed.
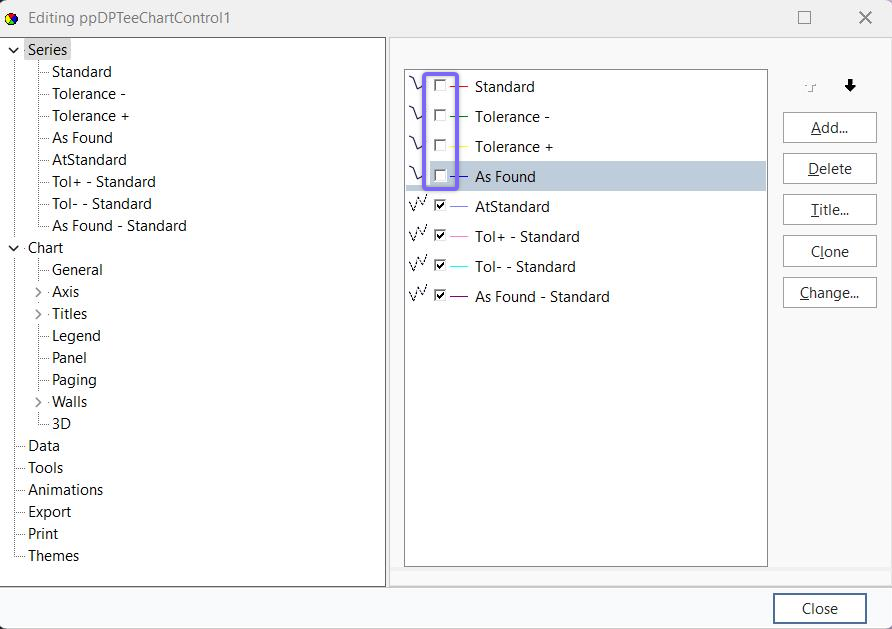
TeeChart Control - Main Screen
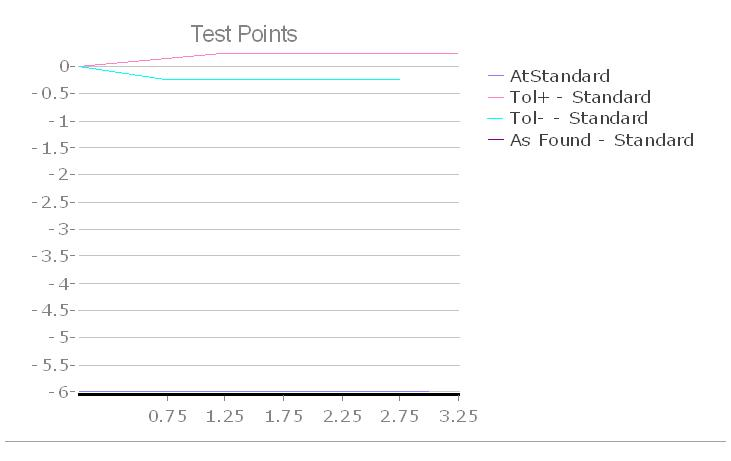
TeeChart Final Result |