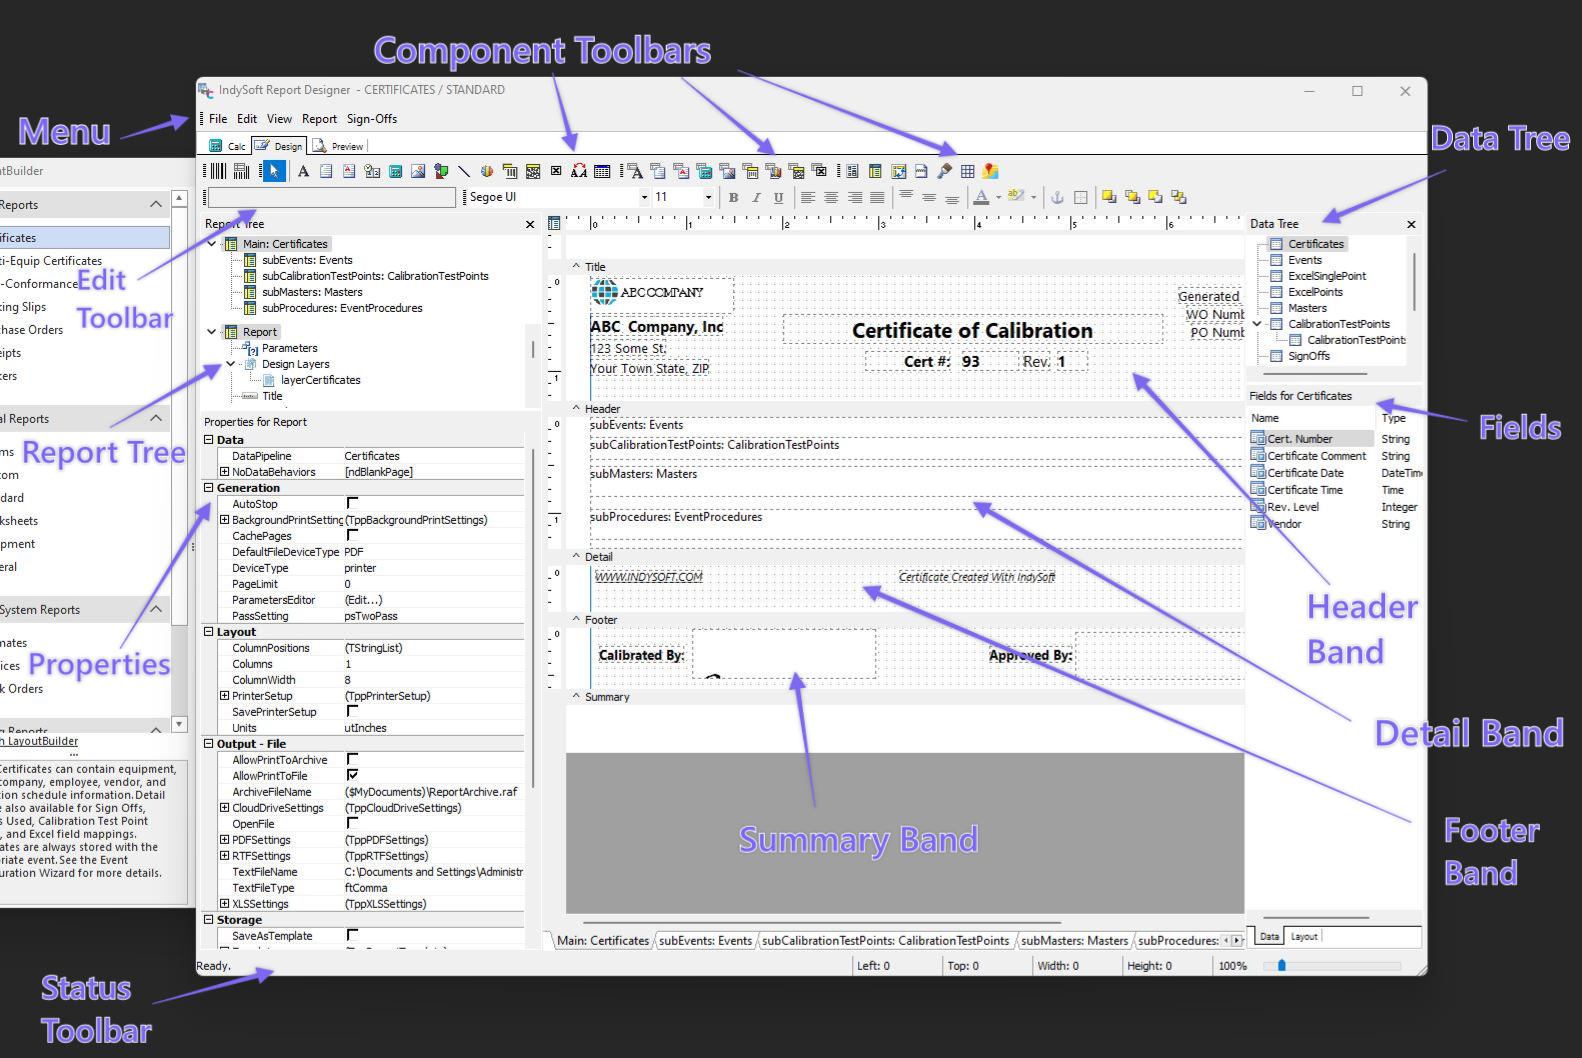
Design Tab - Basic Interface
The major areas of the Designer are listed below.
Component Palette Toolbars
These toolbars are used to create new components. To create a component, click on the icon and then click in the white space of a band. There are three component toolbars: Standard, Data, and Advanced. Use the Standard components to create text, lines, shapes, memos, rich text, etc. Use the Data components to display the data from a database. Use the Advanced components to create more complex reports using subreports, regions, or crosstabs.
·The Menu allows you to customize other elements and perform other basic tasks.
·The Toolbars give you access to the visual elements and controls that allow you to make a professional-looking report.
·The Bands are where you set up the layout of information.
·You can use the Report Tree to see exactly what components are contained in the report and to select individual components.
·The Data Tree can display the data pipelines that can be used to create data-aware components within the report
·SubReport Tabs allow you to switch between pieces of your report and work on it in manageable pieces.
These interface elements are described in more Detail below.
Report Designer - Design Tab Interface
Interface Elements
Menu
The Menu options are described under the Design Tab - Menus.
Toolbars
The Toolbars, Report Tree, and Data Tree are described under the Design Tab - Toolbars.
Bands
These sections of the template contain the 'white space.' Bands can be stretched or shrunk as needed to allow labels and other components to be added.
- Title
Information in the Title band will only be placed at the top of the first page. Place the information in the Header band if you want it copied on each subsequent page.
- Header
Information placed in the Header area will be visible on each report page.
- Detail
The Detail band is the area where database information is placed.
- Footer
Information in the Footer section will be placed at the bottom of each report page. Page numbers and confidentiality statements are examples of common information found in Footers.
- Summary
Information in the Summary section will be placed after the data on the last page of the report. This section is often used to summarize how data was collected or to provide summary data.
- Group
Information contained in a Group band will be collected based on the field the group is set by. This keeps related information together.
- Page Style
Information in the Page Style band is used to format the Detail band. This is an optional technique that allows you to separate formatting from data.
Menu Options For Bands
The following menu options are available when you right-click on a band. (Note**:** not all options are available in each band).
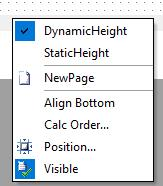
·Dynamic Height
This feature allows a band to stretch in height to accommodate stretchable components.
·Static Height
This feature allows a band's height to remain constant no matter what components are placed inside it.
·NewPage
This feature causes a band to be printed on its own page.
·Calc Order...
This feature allows you to set the order variables are calculated. This can be important if one variable depends on the calculated value of other variables.
·Position...
This feature allows you to manually set the band's height, bottom offset, and print position.
·Visible
This feature determines whether the band will be displayed.
SubReport Tabs
If you have included SubReports in your report, there will be a tab for each one and the Main Report. Simply click on the tab of the section you wish to work on. |