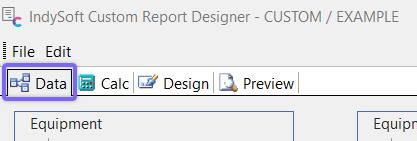
Data Tab
The data workspace is often the key to successful report creation because it allows us to select and manipulate the data needed for a given report. These tasks are accomplished via two visual tools: the Query Wizard and the Query Designer. These tools greatly simplify the often-difficult task of data selection by allowing us to select data without requiring in-depth knowledge of databases.
To create a report, you have to have information to present. For most Template types, the data you can use is already set up for you. Sometimes, however, you have special needs that none accommodate. In that case, the CUSTOM Template type is what you need. It allows you to select the data you want to create a report rather than relying on someone else's choice. You have extra work to do in the Data tab to benefit from this flexibility.
New Data Report
You can't create a template to make dynamic reports without visible data. You can only make a simple text document. Report Designer gives you three ways to decide what data you want to use. The easiest is to take a Data Pipeline you saved earlier by selecting File: Export To File... from the menu and including it by selecting File: Import From File... This will allow you to import a Report Data File (*.dtm) file you or someone else saved earlier.
The other options are found by selecting File: New... You are given two options: Query Wizard or Query Designer.
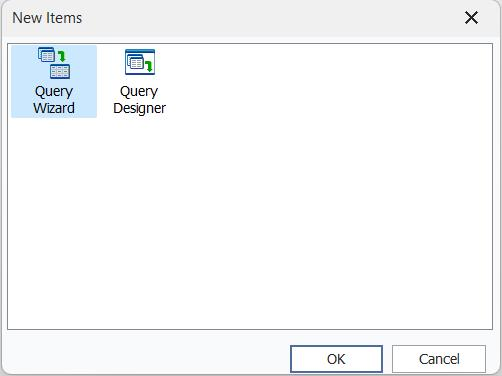
New Data Pipeline Options
Query Wizard
The Query Wizard is simpler but takes longer since you can't skip any steps. Both are covered in more detail below. Before discussing them, however, it will help to understand how the information for a report is stored. IndySoft breaks all the information it stores into logical chunks called tables. Tables are given names to indicate what type of information they hold, such as Company, Equipment, Equipment-Schedules, etc.
Note: the table and field names used in the Custom query wizard are 'friendly' and simply descriptive - they are not the actual table/field names used on the database level. If you are curious to know the exact table/field name, then this can be reviewed from the query objects created on the Query tab (tables/fields subtabs)
Any information that can be displayed is stored in a table. Each table is made of fields or columns that store a type of information and records or rows that store related information. A single asset would be a record in the 'Equipment' table. Each aspect of the asset, such as its I.D., Serial Number, etc, is stored in a field. Regardless of how you decide what data you want to work with, you must choose what tables and fields to use in your reports.
Once you've chosen the Query Wizard, the following dialog will appear. Decide which tables you want to get information from in the list of Available Tables and move them to Selected Tables. For example, scroll down until you find the 'Equipment' table and highlight it, then press the > button. This will add the 'Equipment' table as your export table. If you select multiple tables, you will be asked to join them. This means you are being asked how to link the information together so related information is tied together in a report. Generally, you will use the default. Once you have selected the 'Equipment' table, press the Next button to proceed to Step 2.
Note: after selecting a table that is a 'parent' for other tables, you will see the 'child' tables highlighted in bold for easy selection.
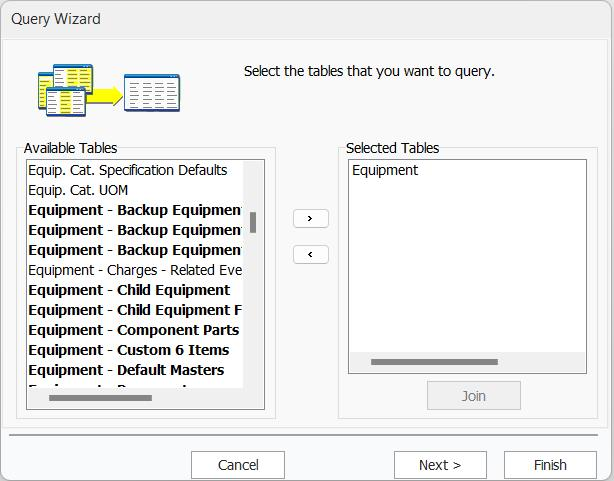
Query Wizard - Table Selection
The next step of the query wizard allows you to report on all the table fields or only specific ones. In our example, we will return six fields, Company, I.D., Serial Number (Gage Id), Status 1, Description, and Master. To do this, choose the 'Choose Fields' selection. Next, highlight the six fields indicated earlier and press the > button for each field. Press Next once you have completed this task.
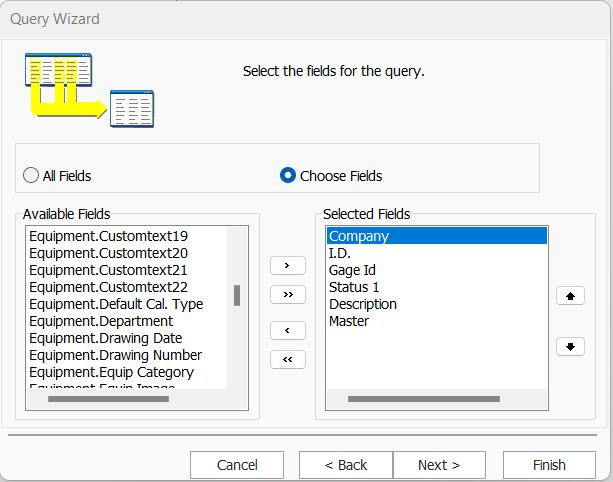
Query Wizard - Fields to Export
Next, you have the option of adding a calculated field. Suppose we wanted to export the total cost of all gages exported in our example. To do this, select 'Add Calculations' and select 'Equipment. Cost' field.
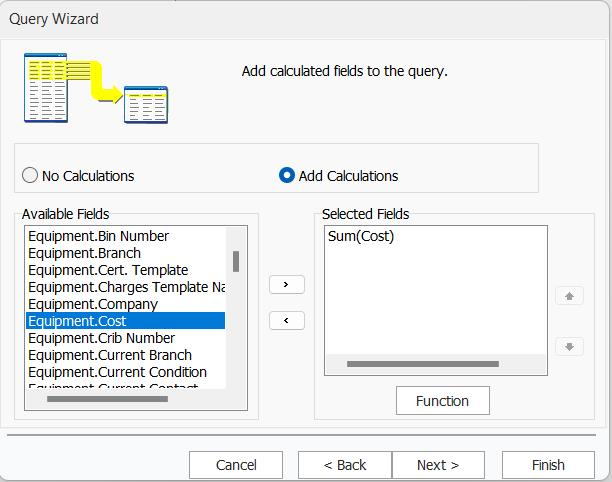
Query Wizard - Add Calculations
After selecting the Gage Cost field, you will get the following dialog. Choose the Sum function to get all costs and press the OK button.
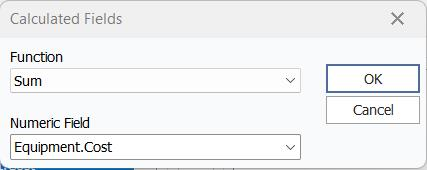
Calculated Field Dialog
Press the next button in the ' Add Calculations' window, and you will be presented with the grouping section of the Query Wizard. In this example, we must group from all fields except for the calculated field because we used a calculated field. This is simply a function of the Query Wizard. Press next to go to the next step. (Note: if there is a field name in the 'Selected Fields' box of the 'Add Calculations Window,' then selecting the 'Function' button will bring up the 'Calculated Field Dialog' if you wish to edit the field.)
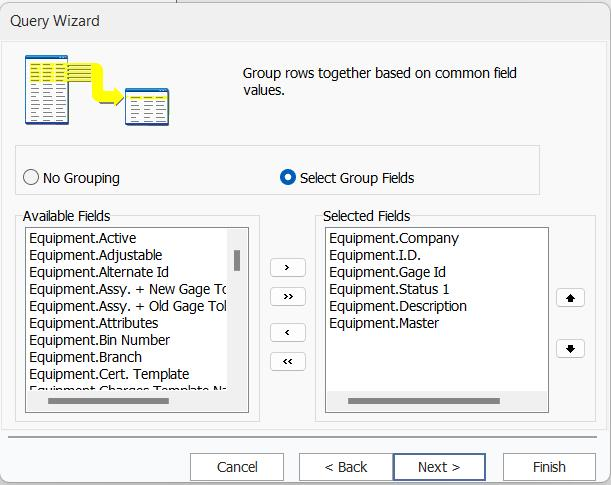
Query Wizard - Grouping Dialog
The next step is used to limit the information that is exported from the Gages table. Suppose we wanted to limit all gage records under the Company 'ABC COMPANY'. After doing so, the criteria screen would look something like this.
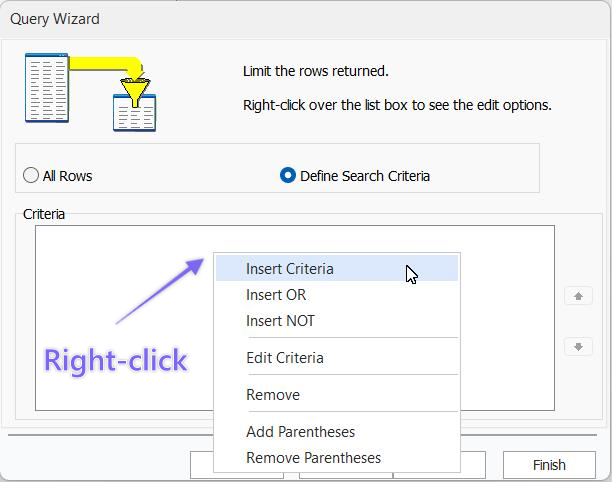
Query Wizard - Limit Rows Returned
To filter your gages, right-click on the Criteria box and choose 'Insert Criteria.'
Next, the Search Criteria dialog will appear. Specify that you want Gages.Company = ABC COMPANY. Next, press OK. The search criteria will then show up as in the above dialog.
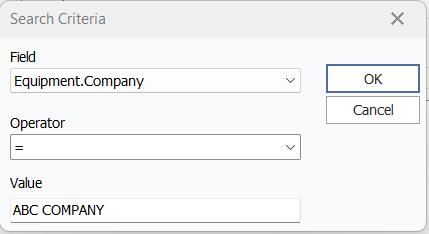
Query Wizard - Adding Search Criteria
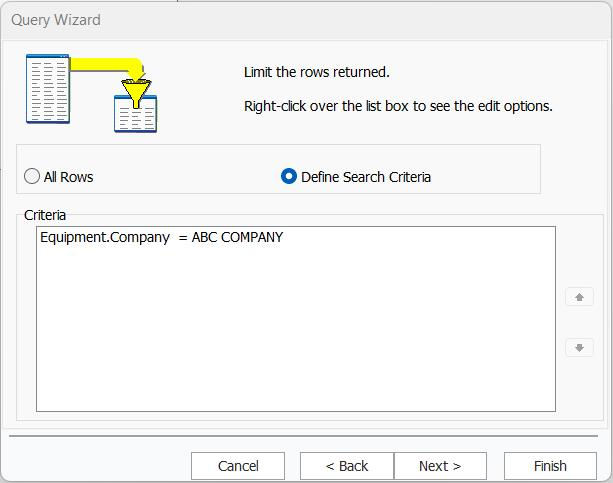
Query Wizard - Result Grid after Adding Search Criteria
Next, you will be given the option of sorting your data. You can either select the 'natural order' (taken from the underlying table's primary database key) or select fields for your order by.
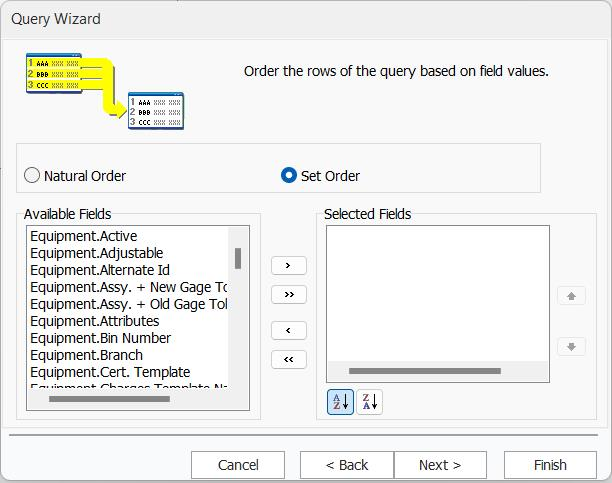
Query Wizard - Order
For the last step, give your Data Pipeline a name. Also, choose to Preview the Query to see what data will be included in the report—press finish.
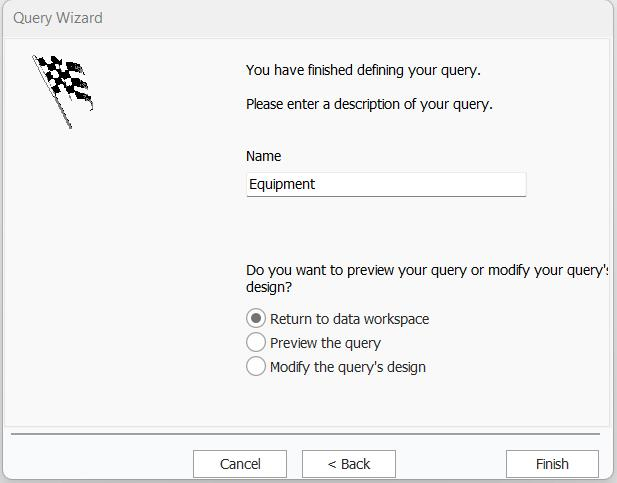
Query Wizard - Final Step
After finishing the Query Wizard, you will see the Data Pipeline in the Data Tab.
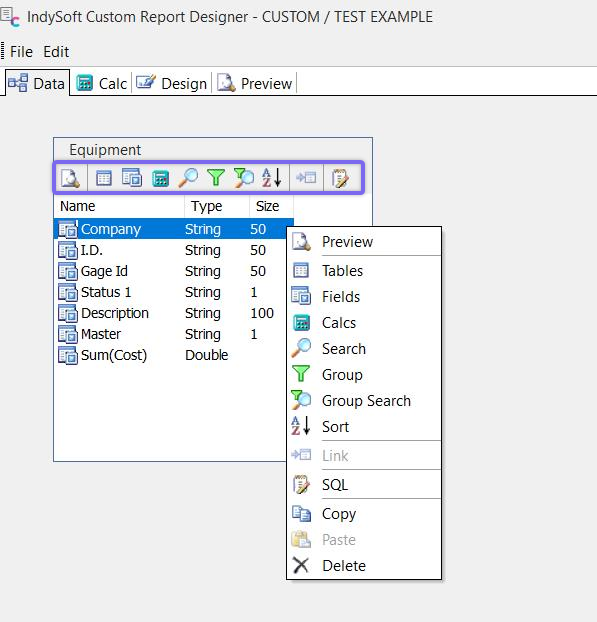
Data Tab after setting Data Pipeline (Right click to show menu)
Additional options are available in the Data Pipeline toolbar or by right-clicking inside the Data Pipeline.
The preview data dialog will show all data listed in the report. Press the OK button once you've looked over your data.
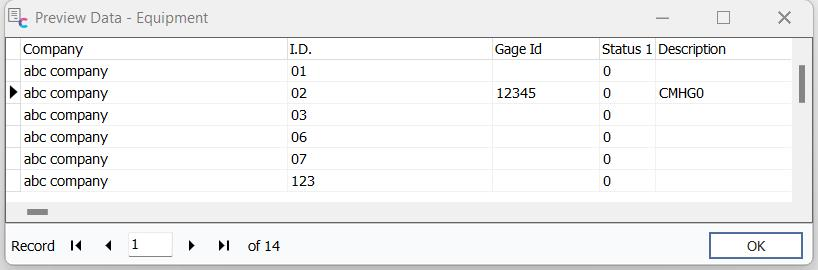
Query Wizard - Preview
Query Designer
A Data Pipeline can be created or edited in the Query Designer. Note: you cannot use the Query Wizard to edit a Data Pipeline once it has been created.
In the Data Tab, select File...New, then Query Designer:
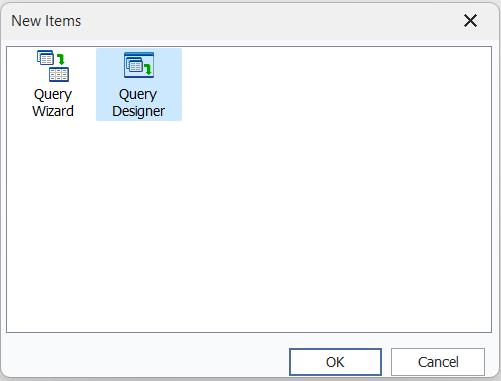
New Query Designer
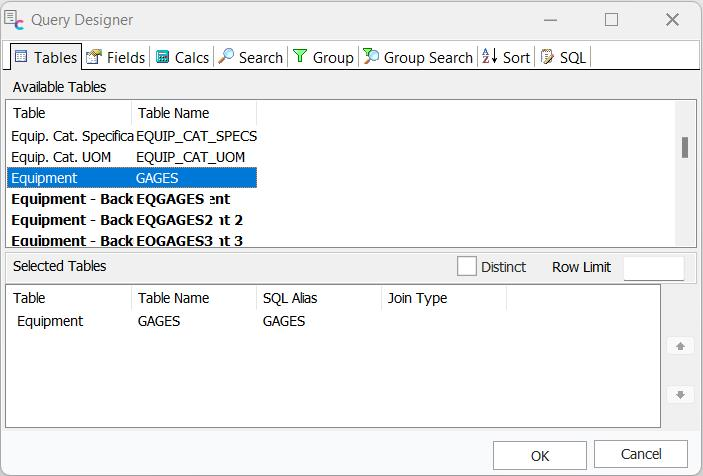
Query Designer - Tables Tab
In the Tables tab, drag an 'Available Table' into the Selected Tables section to include it in your Data Pipeline. You can avoid duplicate results by checking the Distinct check box. This would be useful for designing a report that lists all the Manufacturers/Models of Gages your company works on rather than listing the Manufacturer/Model of every gage. This can make your report much smaller. The SQL Alias is used to help form the SQL statement. Join Type lets you see how two Data Pipelines are joined if you have defined a Join.
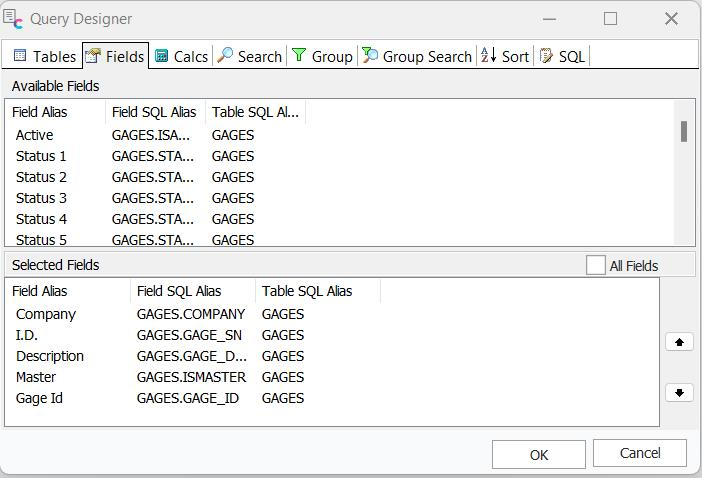
Query Designer - Field Tabs
The Fields tab works the same way, allowing you to drag and drop Fields from the list of 'Available Fields' to the list of Selected Fields. You can check All Fields if you want to use them all.
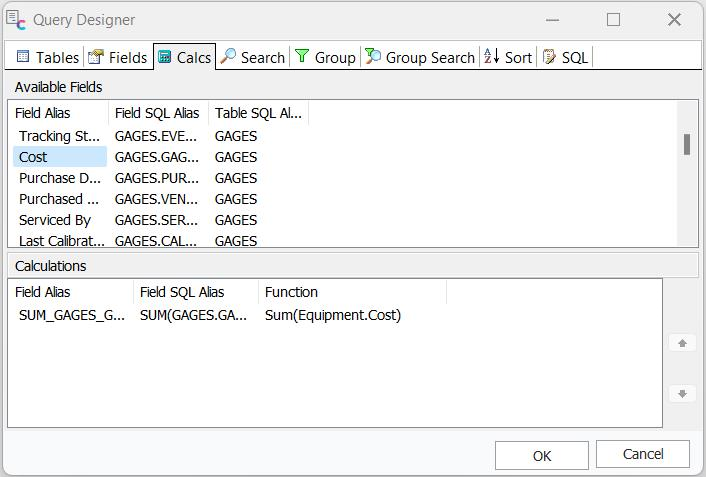
Query Designer - Calcs Tab
In the Calcs tab, drag an Available Field down to the Calculations section to perform a calculation on it. Then select the Function from the drop-down window that appears when you highlight the field. You can add an Expression or rename the current field by right-clicking.
Query Designer - Calcs Tab
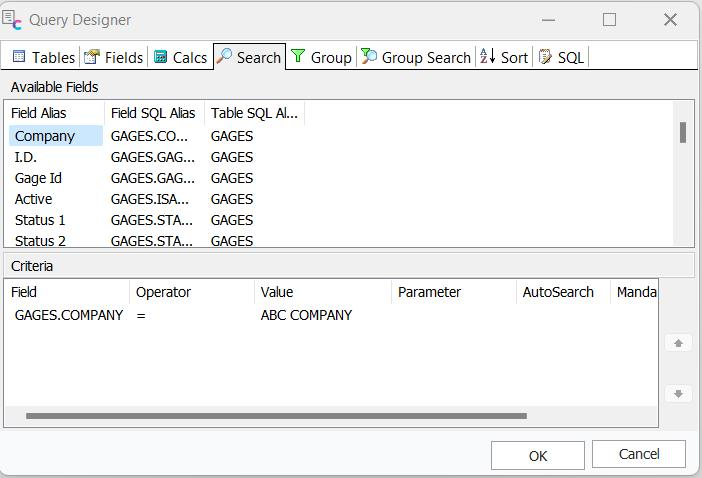
In the Search Tab, you can limit the results based on a field. Select a field, operator, and value to limit your results. (Click on the field name in the Criteria box to highlight).
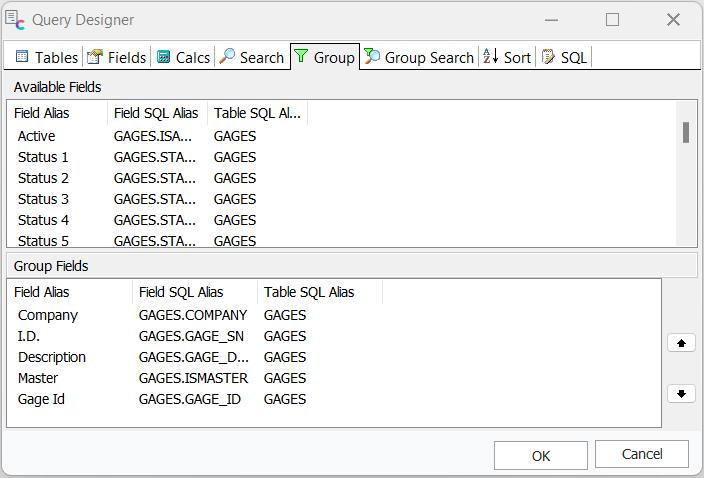
Query Designer - Group Tab
The Group Tab allows you to decide how fields will be grouped, similar to the Query Wizard. Select and drag (or double-click) the fields you want to group into the Group Fields box.
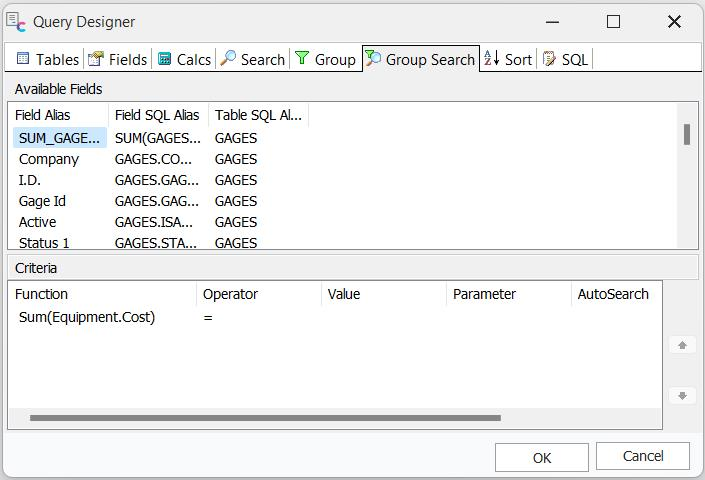
Query Designer - Group Search
Similar to the Search Tab, you can limit the results based on a field with the Group Search tab. Select a field, operator, and value to limit your results. Additional parameters are available as you scroll to the right. (Click on the field name in the Criteria box to highlight).
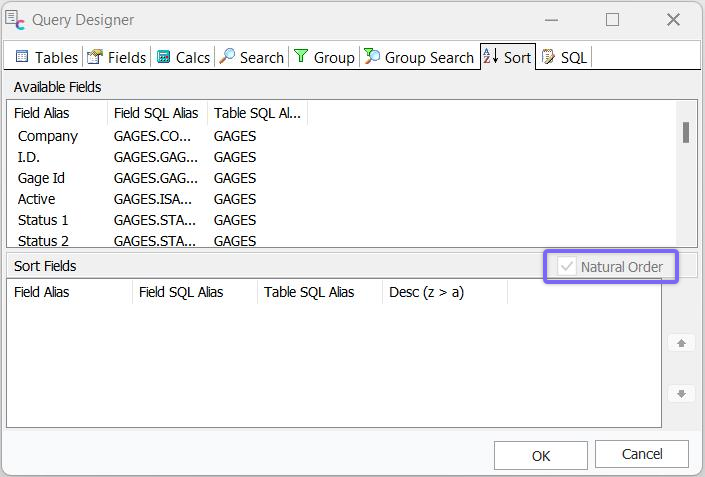
Query Designer - Sort
The Sort Tab gives the option of sorting your data. You can either select the 'natural order' (taken from the underlying table's primary database key) or select fields for your order by.
Finally, the SQL tab will preview the code that has just been created for the Query. |