History Charts
This utility can be launched from the Home View through the 'History Charts' link ('EVENTDIFF').
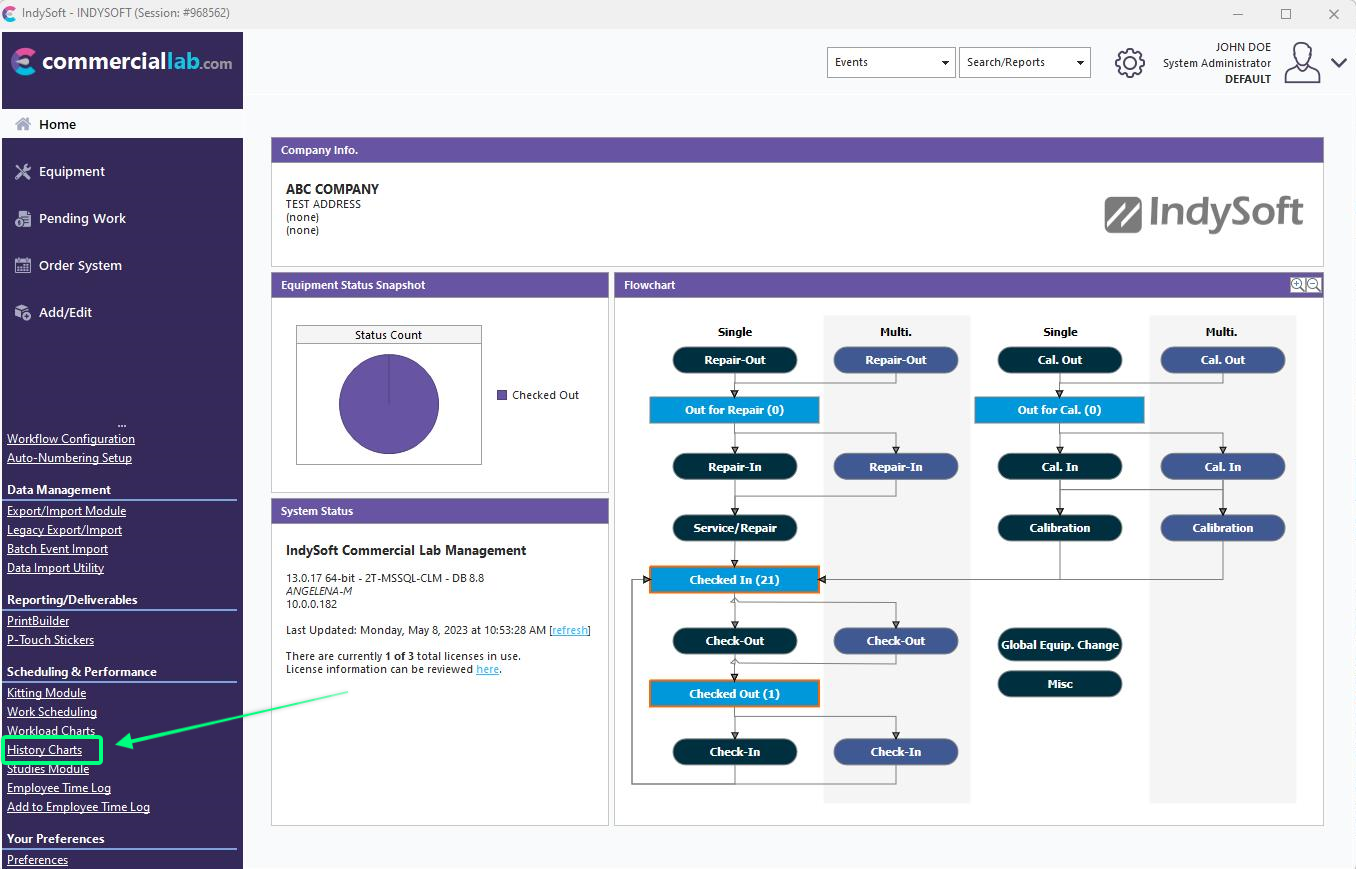
Home View - Locate 'History Charts' Utility
This utility can be used to retrieve turn-around times between two events. For example, say you wanted to know how long it takes on average between your 'Receive' and 'Return To Customer' events for all 'CLAMP METER' assets that came in for service over the past year. This utility could tell you that the average time is 15.12 days and give you a listing of the various event pairs found to create this average.
There are four steps involved in creating a History report - each step has a separate tab:
1.Equipment Filter: The equipment group for the search. This is optional - if none is given, all equipment will be queried. The standard equipment filter box is used.

History Time Difference - Step 1. Equipment Filter
2.Start Event Filter: Select the event type that should start the turn-around time calculation. Next, select an optional event filter (for example, only interested in events within the last year).

History Time Difference - Step 2. Start Event Filter
3.End Event Filter: Select the event type that should end the turn-around time calculation. Next, select an optional event filter (for example, only interested in events within the last year).

History Time Difference - Step 3. End Event Filter
4.Options / Summary: This tab summarizes the three filters and starts/end event types. 2 additional options are available:

History Time Difference - Step 4. Options / Summary
·Exclude all events with a day difference greater than: Use this option to skip any event pairs larger than a specified range. These event pairs would be deemed outliers and should not be considered in the average or report.
·Display Information Using: the grid results include event fields from either the start or end event - make that choice here.
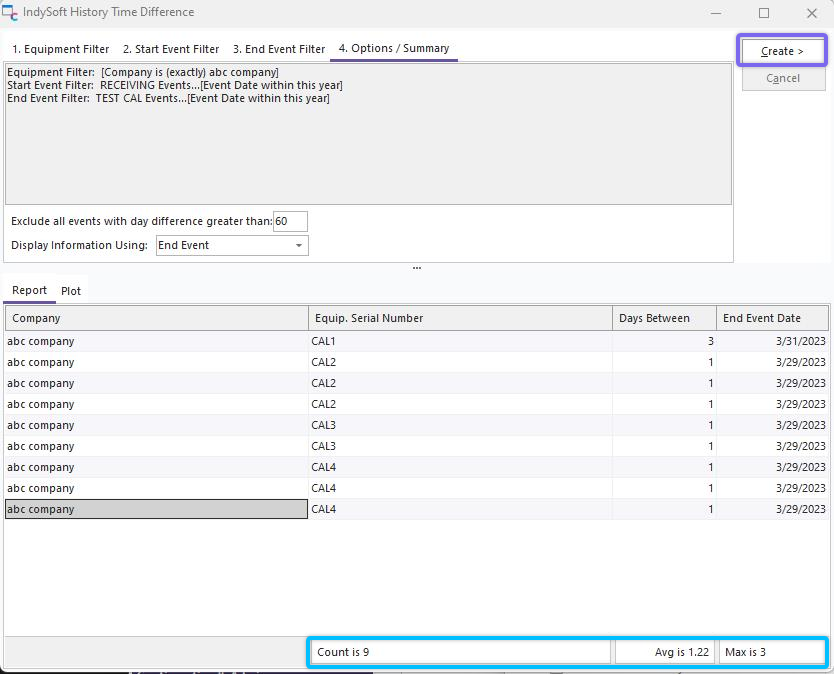
History Time Difference
Press the 'Create' button to show the matching events and summarize results (highlighted purple in the dialog above). The results are shown on two tabs at the bottom of the dialog: Report and Plot. The Report tab includes a grid showing the event pairs (one event pair per line). Note that the grid's footer includes the statistics total Count, Average, Max, and Min (highlighted blue in the dialog above). To export the grid results to the file, use the right-mouse-click options:

History Time Difference - Report - Right-Mouse-Click Options
The same data is also in chart form on the 'Plot' tab.
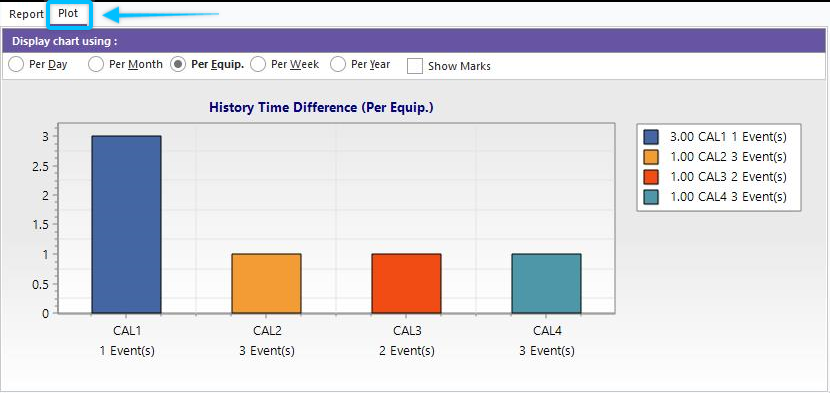
History Time Difference - Plot
The chart can be summarized per day, month, equipment, week, or year. Summary counts are shown in the chart legend on the right. Turn on 'Show Marks' if you would like to see a reminder of counts above each bar:
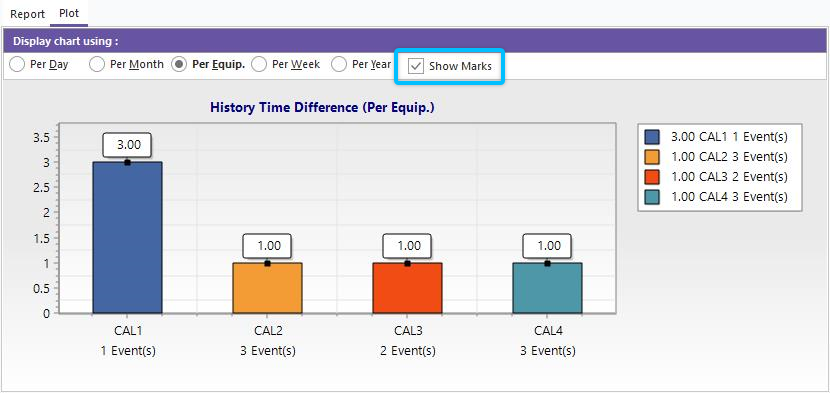
History Time Difference - Show Marks |