Workload Chart Utility
This utility is used to review the upcoming workload for a schedule type and grouping of equipment for a future period. This workload includes all future work for this schedule type, assuming the current schedule interval and frequency. For instance, asset 'ABC123' might have a CALIBRATION schedule of '1 MONTH'. So if it is calibrated on July 1st, the 'next' due date is August 1st. But if you were to use this utility to return a workload estimate for the Fall quarter of the same year (Sept-Dec.), you would see this asset listed four times for likely CALIBRATION: September 1st, October 1st, November 1st, and December 1st. Of course, the actual CALIBRATION dates might be slightly different depending on when the asset is received, etc. - but this tool estimates future workload - so you can better plan for necessary resources, etc. This utility is also helpful to see a combination of assets whose future workload happens to fall heavily within a short time frame. For instance, maybe a particular equipment grouping is currently scheduled to all come due within the same month. To balance the future workload, you might elect to shorten the interval for some of the assets (or modify 'last date performed'), etc. This utility helps you create quick reports that can be sent to pdf, Excel, or HTML - to help you make scheduling decisions.
The top of the dialog provides options for creating the workload report. Beneath these options is a memo box summarizing the current query. A grid and a grid (separate tabs) showing the current workload results are on the bottom. Right-mouse, click within this grid to quickly output the report to pdf, Excel, or HTML.
![]() Note: Since version 9x, the Workload Chart can be used to show future due dates for both date-based schedules and accumulation of time-based schedules.
Note: Since version 9x, the Workload Chart can be used to show future due dates for both date-based schedules and accumulation of time-based schedules.
Workload Options

Workload Options
When you hit 'Select,' you will be prompted with the advanced EquipmentFinder dialog, where you can input filters to specify certain equipment in the workload chart. See EquipmentFinder - Advanced for more information on using the utility. The interface is shown below:
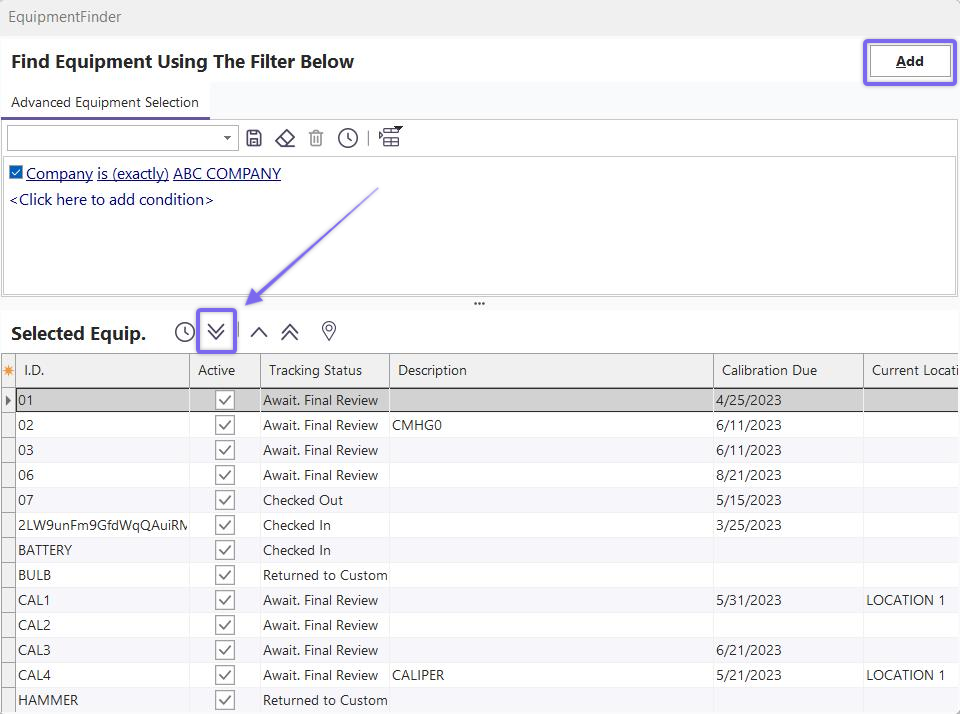
EquipmentFinder - Add Equip
The workload returned by this utility can be grouped/summarized by 'Year,' 'Month,' or 'Week' - make this selection from the 'Date Range' drop-down. Next, select the # of Years/Months/Weeks from the spin-edit below. Next, select the schedule type you want to query, i.e., CALIBRATION, REPAIR, etc. (only one schedule type can be selected). Then select an optional Charge Type - this Charge Type will also be summarized in the workload grid, giving a sub-total and grand-total of the default charges (before any Company discounts) for this work. If a Charge Type summary is not desired, then select the top '' value. This $ summary is helpful because a future month's workload (as an example) is often not necessarily busier regarding # of scheduled work items, but important in billable work. Use the 'Chart By' to select whether the 'Chart' tab should chart a count of assets per group or a sub-total of the Charges for each group. Use 'Chart Type' to select between common chart styles.
Finally, select the equipment group for your workload report using the' Select' button. The standard EquipmentFinder interface is used. Press 'Add' from this dialog to begin the workload search. Note that the memo box below the search options is populated with a summary of the equipment search conditions. Once the search has been created, two additional options are available:
![]() Refresh Results - reload the results using the same options previously selected. This updated search will include any recently performed work saved to the database since the last selection.
Refresh Results - reload the results using the same options previously selected. This updated search will include any recently performed work saved to the database since the last selection.
![]() Print Results - prints a preview of the grid results.
Print Results - prints a preview of the grid results.
The workload results will automatically be grouped depending upon the 'Date Range' selection. The # of groups will depend upon the '# of Years/Months/Weeks' selected. Each group has a count of items in that group and a sub-total of the Charge Type:
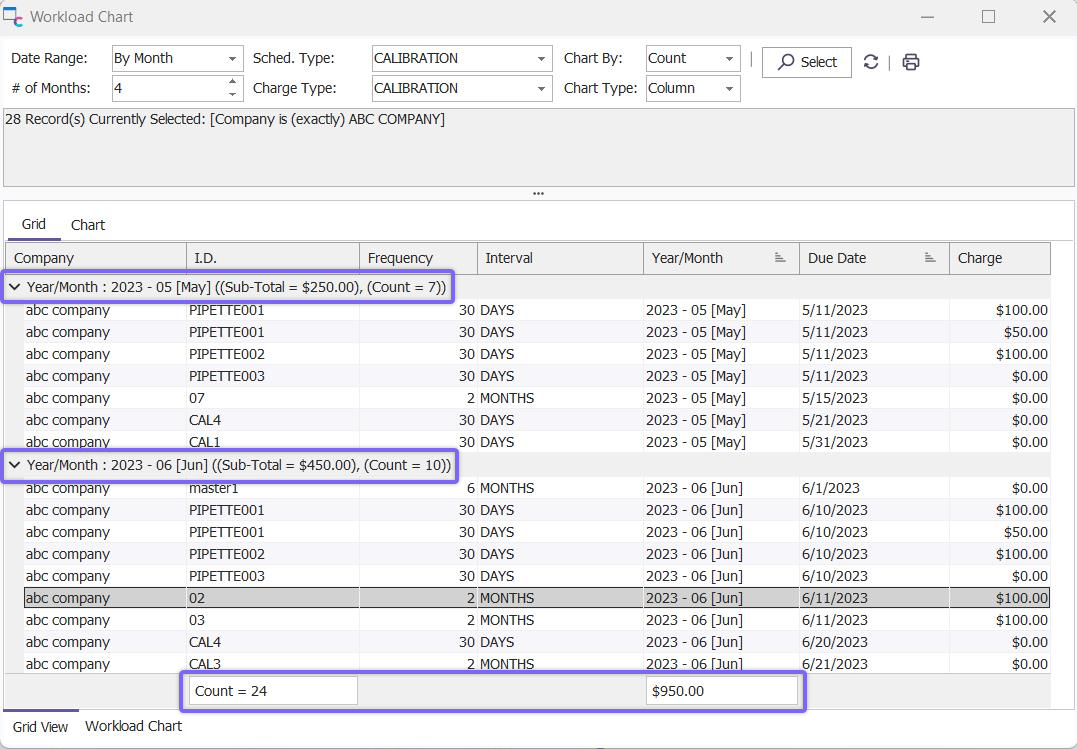
Workload Chart - Grid View Results
To output the grid results to a file, select from the right-mouse click options:
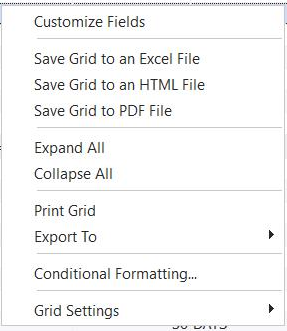
Right-Mouse Click Options - Workload Grid
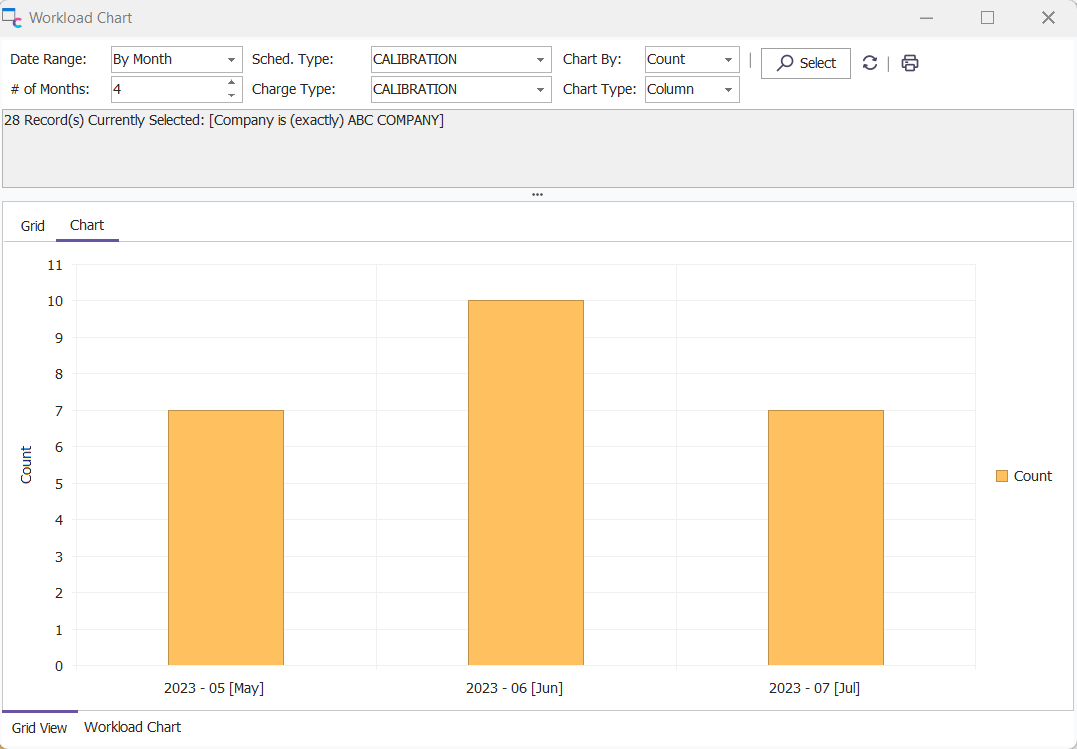
Workload Chart - Chart View
Use the 'Chart By' to select whether the 'Chart' tab should chart a count of assets per group or a sub-total of the Charges for each group. Use 'Chart Type' to select between common chart styles. Note that these options can be modified after executing the 'Select' query. Options selected in the header will be saved per user for the next session.
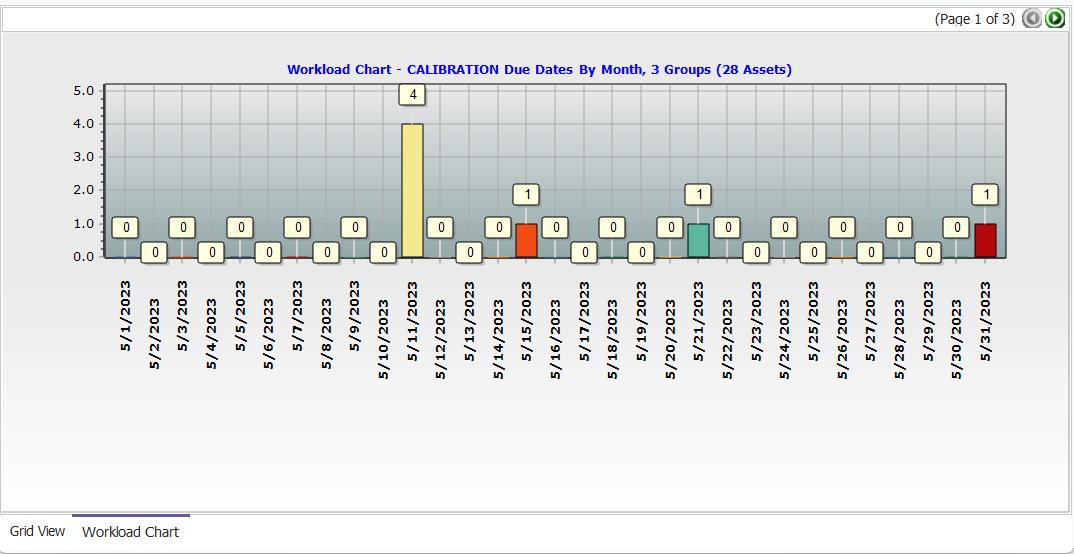
Workload Chart View |