Studies - View Study Results - Step 3 (Stability)
Step 3
In Step 3 (shown below), you can view the Bias Analysis report from the Reports tab.
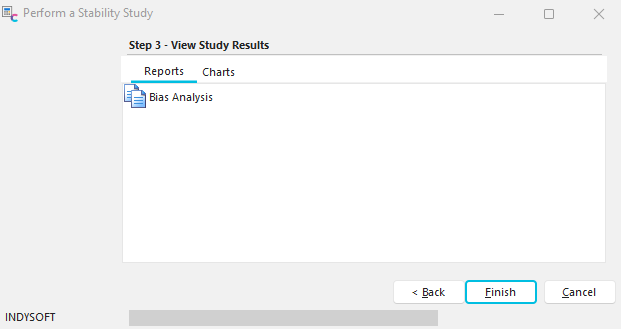
Stability Study - Step 3 - View Study Results (Reports)
You can also view the Xbar and R chart and the Xbar and s chart from the Charts tab.
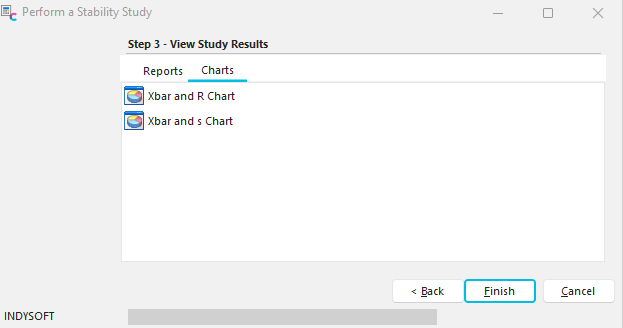
Stability Study - Step 3- View Study Results (Charts)
When a chart is viewed, five buttons are available on the left side of the chart:
Save Chart
This button allows you to save the current chart to a file. Charts can be saved as either bitmap (*.BMP) or Windows MetaFiles (*.WMF). These files can be viewed later with a graphics viewer.
Print Chart
The button allows you to print the current chart. If the Stability Averages chart is visible, then it will print. If the Stability Ranges chart is visible, then it will print. The default printer is used. Typically, this report fills one page, landscape, 8.5 X 11.
Display Chart in 2-D (3-D)
This button toggles the Stability Charts between 3-D and 2-D.
Show Labels
This button toggles on/off labels on the Stability Charts for the measurements listed.
Show Legend
This button toggles on/off a legend on the right side of the stability charts. The legend explains what the various colors refer to in the stability charts. |