Test Points - Trend Chart
This tool lets the user view a test point's As Found status history quickly. To choose which test point to view, select a test point from the Test Points tab of the Equipment View screen.
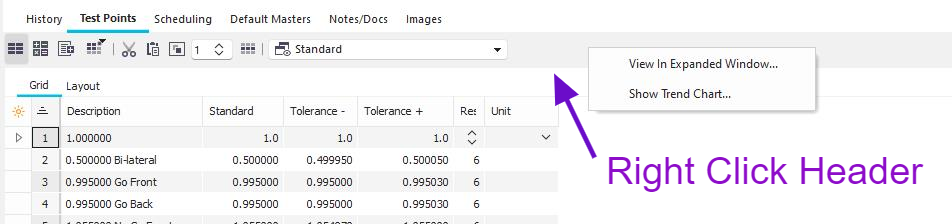
Test Points Tab Tool Bar
Calibration Trend Chart
Right-clicking the Test Points Tab toolbar will enable the 'Show Trend Chart...' option to appear (or also located in the test point window when the 'edit' button is pressed). When clicked on, the Calibration Trend Chart window will open. Note: The trend chart only works with ONE test point at a time selected in the grid before clicking the icon.
The Trend Chart will collect data from at least two completed calibration events. The events must have the same test points in each event (standard, +/- tolerance), or it will not work correctly.
To look at the Trend Chart of other test points, use the arrow icons to the right of the Test Point Group dropdown:

Calibration Trend Chart (basic)
 Save trend chart (.bmp)
 Print trend chart - sends print job directly to a connected printer.
 This toggle button lets you choose the chart in 3D or 2D.

 This toggle button adds or removes the labels.

 This toggle button hides the toolbar and expands the chart. Click anywhere in the expanded window to return to the toolbar.

 Clicking this button will open the IndySoft Email utility to send the chart by email.

 This button lets you toggle on the use of historical tolerances/standard (down) or default tolerances/standard (up) |